Events and Filters
In its primary role HoneySens sensors act as early-warning systems that publish honeypot services to attract and report potential network-based attacks, which are reported as events. This section will show how these events can be examined and how the event list can be kept clean by filtering out false positives.
At this point, we assume a working HoneySens deployment made up of a server, at least one connected sensor and a minimum of one running honeypot service. For further details, please refer to Installation, Sensor Deployment and Services.
Examining events
Sensor by themselves won’t generate any events. Instead, evaluating and responding to network traffic is the responsibility of services that are deployed to sensors. Services typically act as honeypots, which practically means they emulate different network services that could be potential targets for malware or intruders. It’s up to the service implementation what kind of data is reported as an event to the server: Some services thoroughly report every single network connection made to them, while others first classify connections and only alert in case they witness an actual attack.Since services are largely adaptions of open source honeypots, the actual behavior might vary from one service to another. That’s why events should always be taken with a grain of salt: After all, HoneySens is just an early-warning system that can indicate that something fishy might be going on, but doesn’t perform actual threat assessment. Due diligence is key.
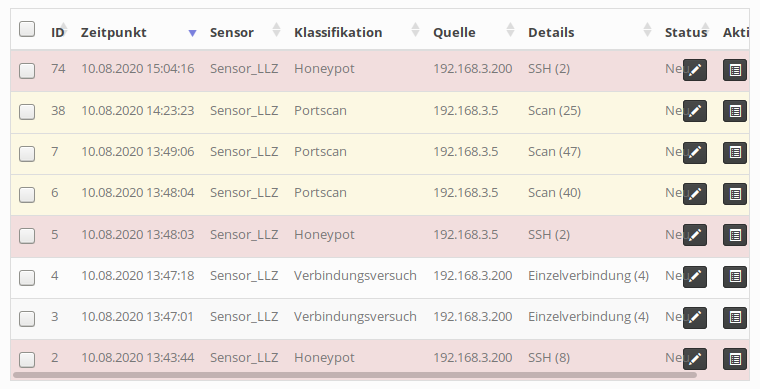
To view reported events, switch to the Events section in the sidebar. An extensive list with all events that have been collected so far will be shown, with the newest event on top:

Each row represents a single event that was reported to the server by a service running on one of the connected sensors. The columns should be mostly self-explanatory:
- ID: Internal event ID
- Timestamp: Date and time of the specific event. In the case of a lengthy network connection, this date specifies the arrival time of the very first packet at the sensor.
- Group: Group of the sensor that reported this event.
- Sensor: The name of sensor that recorded this event.
- Classification: The classification determines the color of an event row and comprises three possible values: Connection attempt, Portscan and Honeypot. It’s up to the service implementation how a specific event will be classified. Currently, the recon service reports connection attempts and scans, while all other services are classified as Honeypot.
- Source: IP address of the event’s source (the potential attacker).
- Details: A brief event summary, its value depends on the service that reports an event. The number in parentheses indicates the number of detailed records available for the event. Those can be shown by clicking on the “Show details” button (see below).
- Status: This flag is intended for users to communicate to peers that an event is currently under investigation, has already been dealt with or can be ignored. Also includes a comment field that can be freely utilized to record additional information about a particular incident. This column is just a support utility to annotate events with additional data, it doesn’t influence the operation of the sensor network itself.
- Actions: The first button shows detailed information about an event, the other one removes an event from the list. In the later case, it’s possible to move the event to an archive instead of fully removing it from the database.
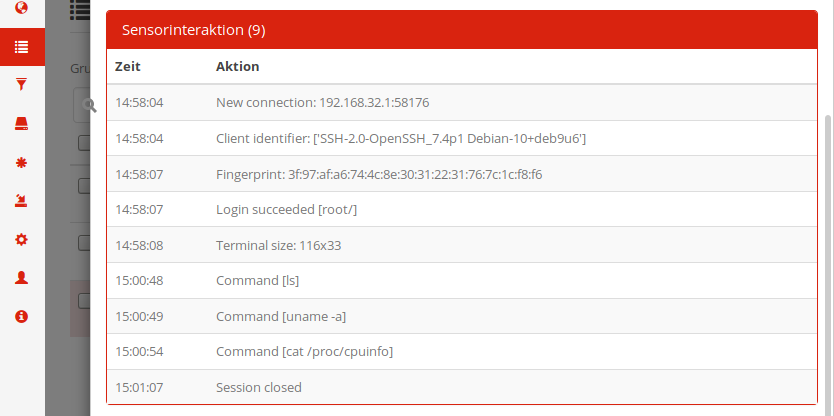
Besides the properties shown in the list, each event can have additional data attached to it, such as an interaction history of the reporting service. That data can be shown by clicking on the “Show details” button. In that dialogue window, below a short summary of the event properties (same as in the overview), a click on Sensor interaction or Packet overview reveals additional data that, again, highly depends on the reporting service:

In this example, we investigate an SSH connection reported by the cowrie honeypot service that originated from 172.20.0.1, TCP port 51008. The attacker logged into the honeypot successfully as root with the password secret and issued three commands on the fake shell offered by cowrie to explore the system.
The event list can also be sorted: Just click multiple times on a column header to order the events either ascending or descending by that column’s attribute. By default, the event list will only show events of status New or In progress and filter out ones that have been marked as Resolved or Ignored. These and other filters can be modified using the controls located above the list.
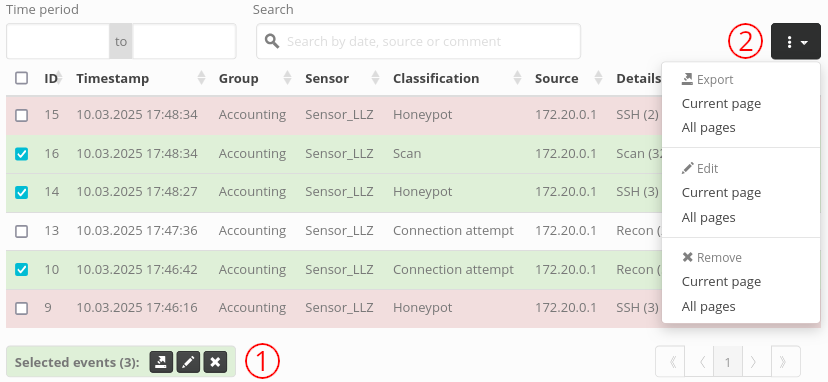
The checkboxes in the leftmost column enable users to perform actions on more than a single event. After selecting at least one such checkbox, a bunch of action buttons appear below the event list ((1) in the following screenshot). They can be used to export (as CSV), edit or remove all selected events at once. Alternatively, the button highlighted as (2) in the screenshot below enables users to perform those same actions either on all currently shown events (Current page) or all events in the database (All pages) - by taking into account the currently selected filters.

Event Archive
Events that are no longer of immediate interest but shouldn’t be deleted entirely can be moved to the event archive. Besides the obvious benefit of cleaning up the event list, removing or archiving events also speeds up event-related database queries in the presence of thousands or millions of events. The decision to do so is integrated into the Remove event dialogue that is shown when attempting to delete events. Enable the Move events to archive checkbox, then proceed to remove the events. Archived events will be recorded as-is, i.e. changing the name of or removing the sensor that recorded such an event won’t be reflected in the archived data. They are also read-only, their status or comment fields can’t be modified.
To view archived events, select Archive from the Dataset dropdown filter. Due to the aforementioned properties, filtering archived events is limited and their status fields don’t permit modifications. When an event is removed from the archived, it is really gone and can only be restored from a backup.
Some optional archive-related automations can be enabled from the System -> Event archive panel: It’s possible to send events with status Resolved or Ignored automatically to the archive after a configurable amount of days. Similarly, already archived events can be removed automatically after a configurable delay.
Filtering out false positives
In addition to the basic filter mechanisms offered by the event list, it’s also possible to register explicit filter rules on the server that drop all incoming events that match a set of rules. The intended purpose is to reduce the amount of “noise” one typically observes when operating honeypots: Even though in theory only suspicious actors inside a network should trigger events, reality has shown that production networks are full of legitimate and legacy services that for various reasons can trigger alerts unintentionally. Specifying rules to filter out such alerts helps with reducing the mass of incoming events to relevant ones.
To manage filters, click on the respective entry in the sidebar. A list of filter rules will be shown, which can itself be filtered according to their group assignment. To add a new filter, click the Add button on the top right. Each filter rule has to be assigned to a group and should be given a unique name. The rule applies only to sensors that are within that group. The actual conditions that make up a filter rule are specified in the lower half of the dialogue:

Additional conditions can be attached to the rule using the Add button. For each condition, one first has to select an attribute that is used for comparison (such as matching on the source of an event or its classification), followed by an attribute-dependent comparison value. In the example shown above, we specified that all port scan events coming from IP address 192.168.3.5 should be matched. An event will be discarded by the server only if all conditions match. Click “Save” to register a rule on the server.
To verify a filter rule, again have a look at the filter list:

Each time the server encounters and discards an event that matches one of the filter rules (all of its conditions), the value in the counter column will increase by one. That way operators can quickly assert that their rules are effective. It’s also possible to temporarily disable filter rules with the leftmost action button. The Status column indicates which rules are currently enabled or disabled.
Event notifications
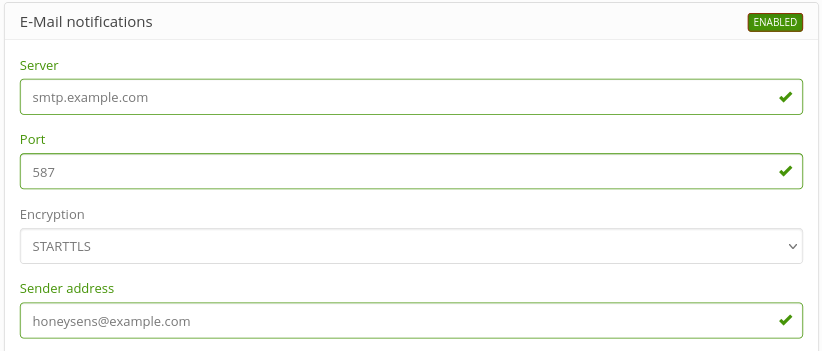
Constantly watching the event list for new incidents - even though it automatically updates itself - would be a rather time-consuming and unpopular task. As an alternative, the HoneySens server can send e-mail notifications in case new events appear. To activate that feature, head to the System section in the sidebar, then click on E-Mail notifications and specify an SMTP server and - if required - credentials. There’s also a button that enables you to send a test mail to an arbitrary target address to verify the SMTP configuration. If that works, click on DISABLED in the top right of the configuration panel to enable e-mail notifications:

As a last step, one needs to specify receivers for e-mail notifications. For each group you can define one or more contacts that will receive notifications from the group’s sensors. Switch to the Users and Groups module in the sidebar and edit the group in question. In the lower part of the form, new contacts can be added with the Add button. Each contact can either be one of the users registered on the server, which have an E-Mail address associated with them, or just any E-Mail address (to notify external contacts). For each contact one needs also to decide what kind of notifications should be received: whether they should be notified about all events, just critical ones (those are by definition events classified as “Honeypot”), weekly summaries (these are sent every Monday) or sensors that lost their connection to the server:

The templates used for e-mail notifications can be freely modified: Head to System -> Notification templates, select one of the template types and check Use custom template to enable customization of the selected template. The shown dynamic template variables can be used as placeholders to insert dynamic data into template, e.g. {{ID}} will be automatically replaced with the event identifier when the notifications are sent out. Click Template preview to view an example how the template might look like in practice, then click Save to persist the changes.
