Taking the tour
For a quick glance on what HoneySens has to offer we prepared a bunch of preconfigured Docker images that can be utilized to quickly set up a demo environment. Please be aware that these images should never be used in production! In case you like what you’re seeing, please go ahead and work your way through the Installation Guide for instructions on how to set up a proper HoneySens deployment.
The demo environment is composed of several server containers and one “dockerized” sensor, running two basic honeypot services.
Requirements
The demo is offered as a bunch of preconfigured Docker images which are published on the GitHub Container registry. To run it, any Linux distribution and a recent version of Docker Engine are required. Please make sure that those are installed, e.g. by verifying the output of docker version, which prints details about the installed Docker components.
Preparing a Compose File
Switch to an empty directory and download the current demo Compose file, save and rename it to docker-compose.yml.
That file defines a minimal preconfigured HoneySens deployment that consists of all services that constitute a server and a single dockerized sensor. In a real-world configuration, the sensor(s) would not run alongside the server, but would be deployed remotely within various production networks for monitoring. In this demo case, however, we deploy server and sensor together to illustrate their basic functionality. All images are preconfigured in a way that the sensor is already registered with the server and some basic honeypot services can be immediately deployed to it right after it starts. The ports directive of the server container forwards your local TCP port 443 (HTTPS) to the HoneySens web interface. In case that port is already taken by another application, feel free to change that value. Since all containers are run within a user-defined network (called honeysens here), they won’t interfere with other applications or containers.
Note: The sensor requires the privileged attribute for proper operation. The reason for that is that the honeypot services are deployed as Docker containers as well, which leads to a nested Docker-in-Docker setup. To run another Docker daemon within an existing Docker container, extended privileges are required.
Starting the demo environment
From the same directory that contains the downloaded docker-compose.yml, the demo environment can be brought up with docker compose up. After a few seconds (as soon as the amount of console output starts to slow down), all required components should be ready and you can access the web interface via https://localhost (or https://localhost:<port> in case you modified the default port configuration). You should be greeted by a login screen:

Here you can authenticate as user admin with password honeysens. After a successful login, the dashboard will be rendered which shows the amount of captured events on a timeline and an event classification breakdown. The web frontend is structured into different modules such as sensor management, event list or user management, which can all be accessed via the sidebar on the left side.
Having a look around
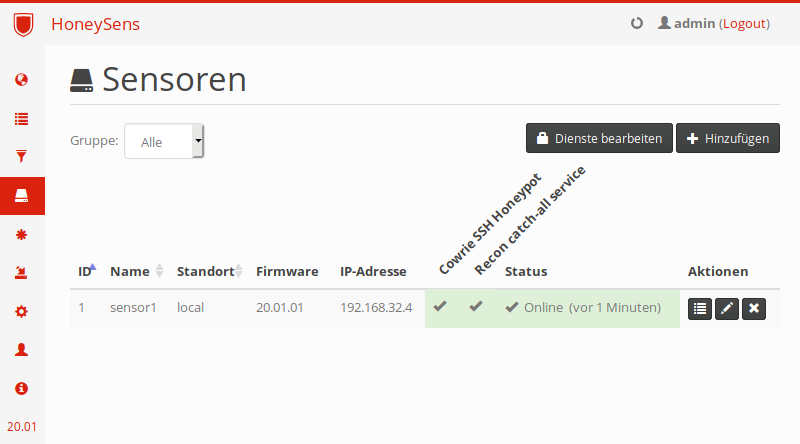
We’ll now discuss a few important modules users will frequently come in contact with when managing a HoneySens deployment. First, we want to get an overview over registered sensors and their current status. For that, move the mouse cursor over the taskbar for automatic expansion and click on Sensors.

The demo environment ships with a single sensor attached to it, which is called sensor1. In the screenshot above, it reports its own IP address as 172.20.0.8 and has two honeypot services enabled: recon and cowrie. If your sensor is still shown with a Timeout or it’s online but the two service columns are shown in blue, don’t worry: The sensor needs a couple of minutes to connect to the server and synchronize its honeypot services. After roughly five minutes, your sensor list should look similar to the one above. By default, sensors poll the server every few minutes to send status reports and update their own configuration. According to the Status column in the screenshot, our sensor has successfully contacted the server within its polling interval, as indicated by the green cell color. The columns with angled text show which honeypot services are enabled on which sensors: In our case, both services are active and running. If you see a blue background here, the services aren’t ready yet (they will be automatically deployed to the sensor on startup). In that case, simply wait a few minutes until the boxes turn green. A red background color indicates that something has gone wrong.
Now, click on the pencil icon within the Actions column to show the current sensor configuration. This ranges from basic settings such as sensor name, location and group assignment to the server connection, update interval and sensor network configuration to more advanced settings such as proxy traversal or custom sensor firmware overrides. For now, simply close the dialogue by clicking Cancel.
Next up is the overview of registered honypot services, which can be shown with a click on Services in the sidebar:

In HoneySens terminology, services are the actual honeypots, which are container images that offer various fake services to attackers. These honeypots are for the most part freely available Open Source honeypots that were slightly modified to interface with HoneySens. Two such services are preinstalled on the demo instance: cowrie, a popular SSH honeypot as well as recon, which is a simple catch-all-traffic daemon that responds to and records any TCP and UDP session. Additional services (that adhere to our custom service specification) can be uploaded to the server with the Add button on the top right. When a new service was uploaded, a new column will be added to the sensor list which allows scheduling of that particular service (as seen previously). When a new service is scheduled, sensors will download and start the service automatically during their next polling interval.
Apart from running sensors as Docker containers (as the demo sensor)
The sensor platform itself is flexible: HoneySens initially started out with just hardware-based sensors, namely the BeagleBone Black (BBB) from Texas Instruments. This platform is still supported, but we also support “software” sensors in the form of Docker containers (the demo sensor is an example of that). If you have a look at the Platforms module, an overview of supported sensor platforms will be shown:

This interface is quite similar to the services module. We call the sensor software that runs on each platform firmware. In the case of dockerized sensors, that term simply denotes the sensor Docker image and some accompanying metadata. For BeagleBones, that firmware encompasses an SD card image with an installer to provision new sensors.
Apart from the already discussed modules, there’s also a System module for general system configuration and management as well as a user and group management area. Sensors and their respective events always belong to a specific group, which enables admins to maintain a single HoneySens server for multiple clients or user groups. We will now move on to the most important topic when operating honeypots: managing events.
Simulating attacks
In this section, we’ll now connect to honeypot services that are currently running on our demo sensor. Since honeypots by default are meant to just passively offer services which under normal circumstances would never be contacted by real clients, any connection attempt to a honeypot would indicate a potential attack and is therefore reported as an event. However, what network traffic the sensor actually reports heavily depends on the selection of honeypot services running there.
Our demo sensor has two active services: the cowrie honeypot which offers a fake SSH service at TCP port 22 as well as the recon catch-all service, which will record and answer any TCP or UDP packet connection received on the sensor’s IP address. While it might seem sensible at first to respond to any suspicious connection attempt, such a host looks very suspicious to attackers as well. As soon as an intruder realizes that she’s just talking to a honeypot, we gain no more valuable data about her behaviour and practices. Insofar one should carefully consider the selection of honeypot services to run on a given sensor. In fact, it’s a recommended honeypot practice to simulate the services offered by nearby real systems as closely as possible.
For now, we’ll connect to both honeypot services running on the demo sensor to generate a bunch of events. We start by connecting via SSH to the sensor IP as we’ve previously discovered in the sensor overview (in our case that’s 172.20.0.8, but yours may vary):
$ ssh root@172.20.0.8
root@172.20.0.8's password:
The programs included with the Debian GNU/Linux system are free software;
the exact distribution terms for each program are described in the
individual files in /usr/share/doc/*/copyright.

Debian GNU/Linux comes with ABSOLUTELY NO WARRANTY, to the extent
permitted by applicable law.
root@s4:~#
We are now connected to the fake SSH service offered by the cowrie honeypot, which allows us to log in as root with any password. On the shell, we’re free to explore the (simulated) vulnerable Linux system with commands such as uname -a or cat /proc/cpuinfo. If you’re done exploring, simple close the connection with Strg+D.
Next, we’ll briefly send a few TCP and UDP packets to a random port so that the recon service catches them. Using netcat, we start with a simple TCP connection on port 80 and sending the string TEST:
$ nc -v 172.20.0.8 80
Connection to 172.20.0.8 80 port [tcp/http] succeeded!
TEST
The recon service will accept that connection, record the first package it receives and then close the connection again. This behaviour enables us to examine the first data packet of any TCP connection, even if there’s no suitable honeypot available for the service that was requested by a client. In the case of UDP, the recon service will simply log the packet without responding at all:
$ nc -u 172.20.0.8 1338
asdf
Now that we generated a few events, let’s look at what exactly was recorded by our sensor.
Examining events
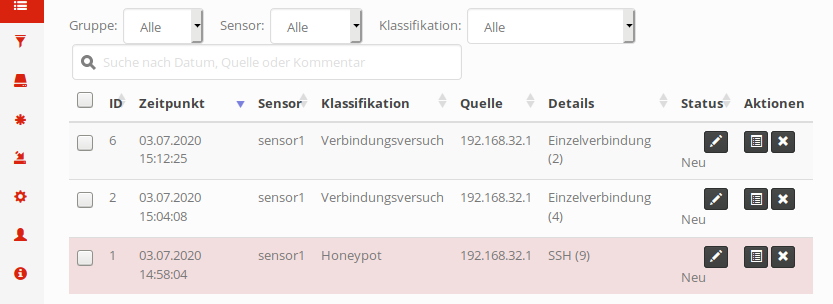
After selecting Events from the sidebar, the event list will be shown. It can be searched, filtered and ordered according to various parameters. Each time a honeypot service running on one of our sensors reports an event, it will be catalogued here for further examination. Apart from a basic classification depending on the service that reported an event, no further processing is done by the server. It’s up to users to assess the risk of each event individually. After all, HoneySens is just an early-warning system that tries to support administrators in spotting spurious network events.

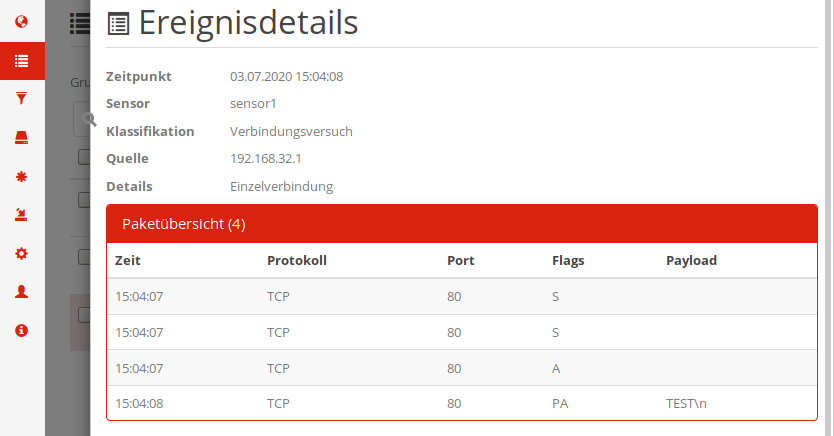
By default, the newest received event will be shown at the top. If you closely followed the guide, that list will consist of exactly three events: The first two being the UDP and TCP connection attempts recorded by the recon service, the third one the fake SSH session. For each event, the table will show when it happened, which sensor recorded it, an internal classification (which also determines the color - red meaning a discrete honeypot service was contacted, SSH in this case), the source IP of the attacker as well as a short summary depending on the service that generated an event. In the Details column, the number in parentheses indicates that there’s further event data available. With a click on the View Details button on the right of each event, more details come to light:

Please note that the packet overview first has to be extended by clicking on the white text Packet overview (4). The top part of that dialogue again summarizes the event, while in the lower half more specific details as reported by the service will be shown. In the case of TCP connections, we see a list of all the TCP packages the recon service received during that connection. After the initial handshake (flags S and A) we see a cleartext representation of the TEST string we sent earlier via netcat.
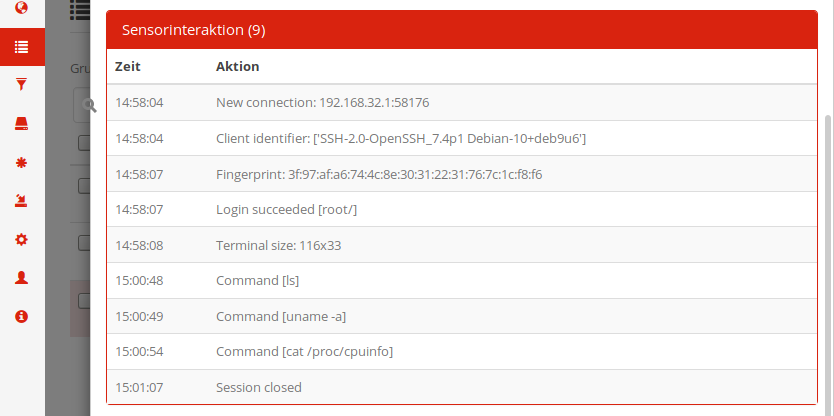
In a similar vein, the SSH event doesn’t list individual packets, but instead the actual interaction with our fake SSH service:

Here, we can track how the connection was initiated, a login as root without password succeeded, followed by a few shell commands.
Cleaning up
After you’re done exploring the demo environment, issue the Strg+C key combination in the terminal where you launched the demo previously. This will stop all demo containers, but won’t immediately remove them (so that you could start them back up again later). To get rid of the containers and all attached volumes, execute docker compose down -v after stopping them.
Next steps
That concludes our short tour through the demo system. Even though you should never run the demo containers in a production environment, it’s still a fully functional deployment that can be useful for toying around with. You can upload firmware, add additional sensors and services. There are also a lot more features not mentioned on this short tour which assist in day-to-day honeypot operations, such as the ability to whitelist recurring (harmless) events via the Filter module or to automatically send E-Mail notifications for events.
In case you’re interested to set up your own HoneySens deployment, have a look at the Installation Guide, which leads through all required steps.
